Enterprise Miner for the performance evaluation of the propensity models using actual campaign results
Product propensity models are developed to identify the customers or observations those have high likelihood of responding to any cross-sell campaign or any event of interest. Model development which includes has multiple steps requires extensive efforts.
1. Identification of business objective or business problem.
2. Identifying analytical objective
3. Identifying data scope and time window.
4. Data preparation and exploration
5. Data treatment and variable reduction
6. Model training and validation
7. Model selection and interpretation
8. Business approval
Steps to automate the model scoring for its periodical usage.
9. Model deployment
10. Periodical Model Scoring
Once the models are scored and used in the campaign for targeting customers to cross sell the product of interest, effectiveness of model must be measured. I am going to discuss the different ways to evaluate the model's robustness. This should not be confused with campaign effectiveness evaluation process.
These metrics helps in answering following questions:
1. Is the model developed 2 years back still usable?
2. Has the model's performance deteriorated?
3. Is it the right time to develop a challenger model?
4. Still the model has ability to separate the bad vs good or responder vs non responders?
Population Stability Index (PSI) :.
PSI measures the shifts in population over the period. As models are developed using the historically observed data, it is must to ensure that current population have similar characteristics to the historical population from which the model is based. Lower is the PSI, lesser is the shift in population and higher corresponds to greater shifts in population.
PSI is calculated using the following formula.

To illustrate the calculation of the metrics and I am using a model which I created for cross -selling a product to the customers. The table below shows how easily PSI can be calculated and used for model's relevancy measurement.
 |
11. PSI <0.1 indicates no significant shift in population and the model can be used for objective desired.
2
22 0.1 <PSI <0:25 indicates minor change in population and some investigation may be required but model can be used with some adjustment.
22 0.1 <PSI <0:25 indicates minor change in population and some investigation may be required but model can be used with some adjustment.
33. PSI> 12:25 indicates there is significant shift in the population or population characteristics have changed. Major investigation is required. It is recommended that model should be redeveloped using current data of the population.
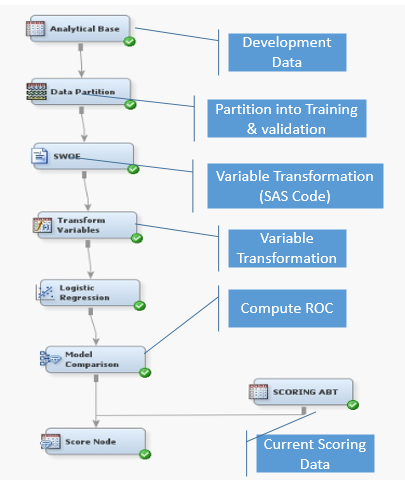
To Compute the PSI value current population must be scored. Enterprise Minor can be used to score the current population. Scoring table should be created following all the subset criteria and business decision taken during the model development process. Current scoring base should be connected to score node of the E-Miner. score takes two inputs- node or best scoring table and selected model. When scoring is imported in the E-Miner, Data assigned role should be "Score". The role data can be changed from node as properties. well.
Receiver Operating Characteristic (ROC) Index :An ROC of 0.75 means that a randomly selected from the case with the group event =1 has a score greater than that for a case chosen randomly from the group with the event = 0 in 75% of the time. ROC Chart displays the sensitivity. and specificity for the entire Range of cutoff values. As the cutoff decreases, more and more cases are allocated to class 1. Hence, increases sensitivity, specificity decreases.
Lift:
Lift measures the effectiveness of a classification model calculated as the ratio between results obtained with and without the model.
Actual Responses of product cross-sell campaign can be used to measure the effectiveness of the model regularly. A binary variable for responder can be easily created using campaign responses for all the scored customers. The dataset which has final variables of the model and actual results can be used from the campaign as a Test Data in E-Miner to calculate the ROC, LIFT and statistical other metrics. This allows us to compare the metrics across training, validation and test dataset. If these values are very close then model is effective and performing well.
Actual Responses of product cross-sell campaign can be used to measure the effectiveness of the model regularly. A binary variable for responder can be easily created using campaign responses for all the scored customers. The dataset which has final variables of the model and actual results can be used from the campaign as a Test Data in E-Miner to calculate the ROC, LIFT and statistical other metrics. This allows us to compare the metrics across training, validation and test dataset. If these values are very close then model is effective and performing well.
Below steps should be followed to use the actual campaign results as test data.
- Prepare the data table to be used as test data set by joining the latest scoring table with the latest actual results. Ensure that corresponding scoring table and actual results are joined.
- Import this dataset as additional data source with either raw / train data role.
- If SAS code node is used for grouping / binning of variable use EG or SAS code for same type of treatment before data partitioning node.
- Add a data partition node, this time with the following set-up: train: 0%, validation 0% and test 100%.
- Add a model comparison node after the selected model node.
The below diagram shows how above steps are step in E-miner.
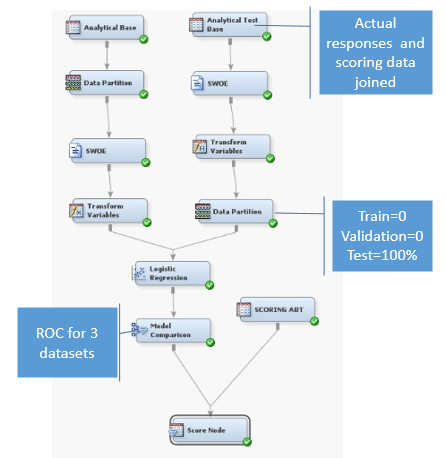
Model comparison node produces table of Statistics for comparison and chart for Training, Validation and Test datasets. These diagnostics can be used for testing model. I have inserted ROC chart and Cumulative Lift chart for my model. There is no significant change in the ROC chart and Cumulative Lift Chart between training and test data which are indicator of a robust model. RoC Index is also 77.2% and 76.5% for training and test data respectively.

Rank Order of Responses:
Percentage of responders should be monotonously decreasing in the decile when observed from higher deciles to lower deciles. Slight breaks observed in lower drder does not indicate major issue.

If the model satisfies all above diagnostics, then it can be used for campaign and will produce positive outcome.

The above table shows pictorially that for the model considered in my example satisfies all the diagnostic criteria and hence should be continued.
Thanks.
Thanks.
Comments
Post a Comment